Earnings per share were worse, but after excluding certain items came in a bit better than last year.
Clearly the Street was impressed with these numbers as the stock price surged as much as 25% in the after hours session. This is probably more a function of the drastically reduced share price in recent months than the actual reported numbers. The stock price since November of last year has retraced a significant portion of its prior advance and it's clear that the market thinks it has run its course at least for now.
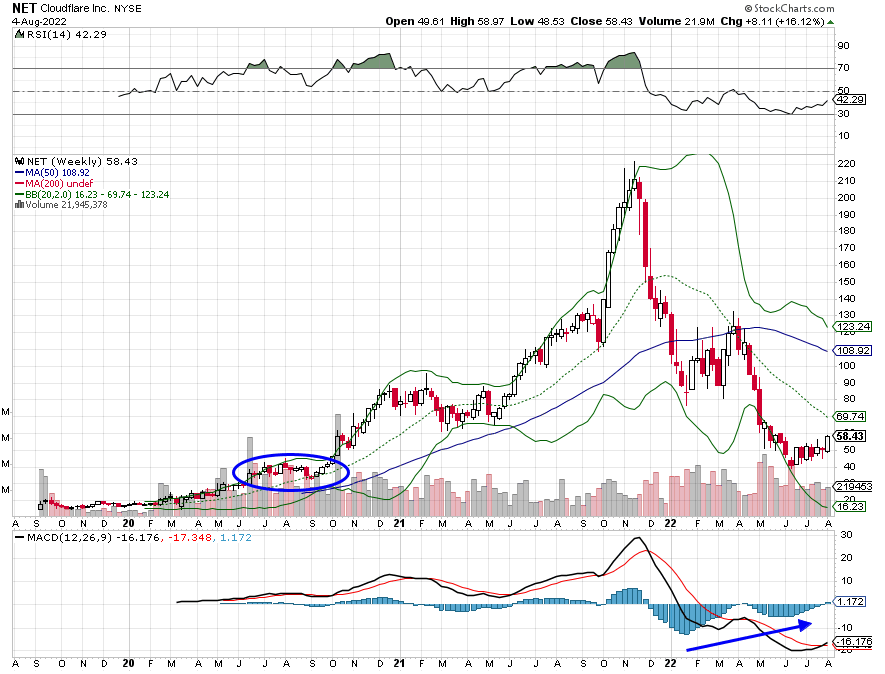
The chart above is a weekly chart of Cloudflare since its IPO. The stock ran up to nearly 50 and established its first base in the fall of 2020. After consolidating there for a couple of months it ran up to nearly 100 before basing again. Then into late last year it experienced a parabolic blow off top to over 220 as the rest of the market topped as well. Talk about exuberance! It is not uncommon for parabolic patterns to retrace large portions of prior moves and this certainly was no exception. It had a massive drop into January of this year along with the rest of the market, a small consolidation into late March and then the final plunge to the recent low under 40. Now that is a volatile stock.
Growth stocks are very sensitive to interest rates and this one certainly is as well. It will definitely be sensitive to news from the Federal Reserve on its current hiking cycle, but with the 10-year Treasury having recently put in at least a short-term top NET seems to have found its footing.
Notice on the chart how the low in January of this year occurred within the second base I mentioned earlier (second half of Feb 2021). This is a common area to find support for a larger retracement. It is also not surprising to see the recent low below 40 happen within the first base area (blue ellipse). That, coupled with bullish MACD divergence indicated by the blue arrow, is a strong indication of a tradable low.
Update: Looks like that call for a tradable low for June was right.
Fundamental Picture
So the stock's chart was set up for a positive move right before earnings. People were clearly feeling the worst was over in terms of stock price. In its earnings release the company raised both revenue and earnings guidance giving the market the green light to bid its shares up.
This volatile stock and former high flier will definitely be exciting to watch in the months ahead.